We Moved @ statsravingmad.com/blog
It’s time,huh?
April 7, 2010
Leave a comment
Well, i managed to take my personal webspace somewhere out there and of course the first thing to set up was my blog ;). WordPress, was great but there was limitations you know. At this point I’d like to present you my new blog address, statsravingmad.com/blog. I hope y’all follow me there. Please update you bookmarks…
CU!
Categories: Uncategorized
In church…
April 2, 2010
Leave a comment
Categories: Uncategorized
church, cyann ben version, m83, video, youtube
Probability manipulations with Mathematica…
April 1, 2010
Leave a comment
There comes a time that a statistician needs to do some ananytic calculations. There more than a bunch of tools to use but I usually prefer Mathematica or Maple. Today, I’m gonna use Mathematica to do a simple exhibition.
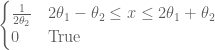
Let’s set this example upon the 
pfun = PDF[UniformDistribution[{2*Subscript[θ, 1] - Subscript[θ, 2],
2*Subscript[θ, 1] + Subscript[θ, 2]}], x]
One of the most intensive calculations is the characteristic function (eq. the moment generating function). This is straightforward to derive.
cfun=CharacteristicFunction[UniformDistribution[
{2*Subscript[θ, 1]-Subscript[θ, 2],2*Subscript[θ, 1]+Subscript[θ, 2]}],x]

The Table[] command calculates for us the raw moments for our distribution.
Table[Limit[D[cfun, {x, n}], x -> 0]/I^n, {n, 4}]

Calculate the sample statistics.
T=List[8.23,6.9,1.05,4.8,2.03,6.95];
{Mean[T],Variance[T]}

Now, we can use a simple moment matching technique to get estimates for the parameters.
Solve[{Mean[T]-2*Subscript[θ, 1]==0,-(2*Subscript[θ, 1])^2+
1/3 (12 Subscript[θ, 1]^2+\!\*SubsuperscriptBox[\(θ\), \(2\), \(2\)])-
Variance[T]==0},{Subscript[θ, 2],Subscript[θ, 1]}]

Check the true value for the 
Reduce[2 Subscript[θ, 1]-Subscript[θ, 2]<=2 Subscript[θ, 1]+Subscript[θ, 2],
Subscript[θ, 2]]

Then, 
A von Mises variate…
March 25, 2010
Leave a comment
Inspired from a mail that came along the previous random generation post the following question rised :
How to draw random variates from the Von Mises distribution?
First of all let’s check the pdf of the probability rule, it is ![f(x):=\frac{e^{b \text{Cos}[y-a]}}{2 \pi \text{BesselI}[0,b]}](https://s0.wp.com/latex.php?latex=f%28x%29%3A%3D%5Cfrac%7Be%5E%7Bb+%5Ctext%7BCos%7D%5By-a%5D%7D%7D%7B2+%5Cpi++%5Ctext%7BBesselI%7D%5B0%2Cb%5D%7D&bg=ffffff&fg=555555&s=0&c=20201002)

Ok, I admit that Bessels functions can be a bit frightening, but there is a work around we can do. The solution is a Metropolis algorithm simulation. It is not necessary to know the normalizing constant, because it will cancel in the computation of the ratio. The following code is adapted from James Gentle’s notes on Mathematical Statistics .
n <- 1000
x <- rep(NA,n)
a <-1
c <-3
yi <-3
j <-0

i<-2
while (i < n) {
	i<-i+1
	yip1 <- yi + 2*a*runif(1)- 1
	if (yip1 < pi & yip1 > - pi) {
		if (exp(c*(cos(yip1)-cos(yi))) > runif(1)) yi <- yip1
		else yi <- x[i-1]
		x[i] <- yip1
	}
}
hist(x,probability=TRUE,fg = gray(0.7), bty="7")
lines(density(x,na.rm=TRUE),col="red",lwd=2)

Categories: probability, statistics
algorithm, code, distribution, metropolis, R, simulation, von mises
R 2.11.0 due date
March 24, 2010
Leave a comment
This is the announcement as posted in the mailing list :
This is to announce that we plan to release R version 2.11.0 on Thursday,
April 22, 2010.

Those directly involved should review the generic schedule at
http://developer.r-project.org/release-checklist.html

The source tarballs will be made available daily (barring build
troubles) via
http://cran.r-project.org/src/base-prerelease/

For the R Core Team
Peter Dalgaard
Categories: infos
announcement, new, R, version
The distribution of rho…
March 21, 2010
Leave a comment
There was a post here about obtaining non-standard p-values for testing the correlation coefficient. The R-library
SuppDists
deals with this problem efficiently.
library(SuppDists)

plot(function(x)dPearson(x,N=23,rho=0.7),-1,1,ylim=c(0,10),ylab="density")
plot(function(x)dPearson(x,N=23,rho=0),-1,1,add=TRUE,col="steelblue")
plot(function(x)dPearson(x,N=23,rho=-.2),-1,1,add=TRUE,col="green")
plot(function(x)dPearson(x,N=23,rho=.9),-1,1,add=TRUE,col="red");grid()

legend("topleft", col=c("black","steelblue","red","green"),lty=1,
		legend=c("rho=0.7","rho=0","rho=-.2","rho=.9"))</pre>
This is how it looks like,

Now, let’s construct a table of critical values for some arbitrary or not significance levels.
q=c(.025,.05,.075,.1,.15,.2)
xtabs(qPearson(p=q, N=23, rho = 0, lower.tail = FALSE, log.p = FALSE) ~ q )
# q
#     0.025      0.05     0.075       0.1      0.15       0.2
# 0.4130710 0.3514298 0.3099236 0.2773518 0.2258566 0.1842217
We can calculate p-values as usual too…
1-pPearson(.41307,N=23,rho=0)
# [1] 0.0250003
Categories: statistics
code, distribution, hypothesis, p-value, pearson, R, test
Oh, mr counselor!
March 19, 2010
Leave a comment
Xm…
There were two men trying to decide what to do for a living. They went to see a counselor, and he decided that they had good problem solving skills.
He tried a test to narrow the area of specialty. He put each man in a room with a stove, a table, and a pot of water on the table. He said “Boil the water”. Both men moved the pot from the table to the stove and turned on the burner to boil the water. Next, he put them into a room with a stove, a table, and a pot of water on the floor. Again, he said “Boil the water”. The first man put the pot on the stove and turned on the burner. The counselor told him to be an Engineer, because he could solve each problem individually. The second man moved the pot from the floor to the table, and then moved the pot from the table to the stove and turned on the burner. The counselor told him to be a mathematician because he reduced the problem to a previously solved problem.
– From The Mathematician, The Physicist and The Engineer (and Others)
In search of a random gamma variate…
March 16, 2010
9 comments
One of the most common exersices given to Statistical Computing,Simulation or relevant classes is the generation of random numbers from a gamma distribution. At first this might seem straightforward in terms of the lifesaving relation that exponential and gamma random variables share. So, it’s easy to get a gamma random variate using the fact that

The code to do this is the following
rexp1 <- function(lambda, n) {
  u <- runif(n)
  x <- -log(u)/lambda
  }

rgamma1 <- function(k, lambda) {
  sum(rexp1(lambda, k))
}
This works unfortunately only for the case
Read more…

Categories: statistics
distribution, gamma, generation, number, R, random, sampler, simulation
\pi day!
March 14, 2010
Leave a comment
It’s π-day today so we gonna have a little fun today with Buffon’s needle and of course R. A well known approximation to the value of 

estPi<- function(n, l=1, t=2) {
 m <- 0
 for (i in 1:n) {
 x <- runif(1)
 theta <- runif(1, min=0, max=pi/2)
 if (x < l/2 * sin(theta)) {
 m <- m +1
 }
 }
 return(2*l*n/(t*m))
}
So, an estimate would be…
Read more…
Categories: probability, statistics
Buffon's Needle, code, day, estimate, pi, R
A normal philosophy…
March 11, 2010
Leave a comment
The following was sent by email to me. It originates to Youden.
                                 THE
                                NORMAL
                             LAW OF ERROR
                           STANDS OUT IN THE
                         EXPERIENCE OF MANKIND
                        AS ONE OF  THE BROADEST
                       GENERALIZATIONS OF NATURAL
                     PHILOSOPHY . IT SERVES AS THE
                   GUIDING INSTRUMENT IN RESEARCHES
                IN THE PHYSICAL AND SOCIAL SCIENCES AND
               IN MEDICINE AGRICULTURE AND ENGINEERING .
          IT IS AN INDISPENSABLE TOOL FOR THE ANALYSIS AND THE
INTERPRETATION OF THE BASIC DATA OBTAINED BY OBSERVATION AND EXPERIMENT
–W.J. Youden
Youden is one of the truly inspiring statisticians to me.
Categories: infos
distribution, normal, youden
Chat online!
 @ManosPar
- An error has occurred; the feed is probably down. Try again later.
myProfiles

Unknown Feed
- An error has occurred; the feed is probably down. Try again later.
